Lunes, Nobyembre 9, 2015

5 Must-Know Google Analytics Strategies To Measure SEO Success

You know what they say, “If you can’t measure it, you can’t improve it.” In Search Engine Optimization measurement is critical to success. Sure, keyword rankings are a great measure of SEO. More keywords ranking higher means more traffic, right? But, reporting solely on keywords devalues the marketer’s role and doesn’t paint the full picture of why SEO is important to the organization. Going beyond keyword rankings allows marketing teams to showcase what really matters: how organic search brings revenue and profit to the business. Thankfully, one of the best tools for measuring SEO is freely available, and probably already installed on your website – Google Analytics!

Although every business is unique and every website has different metrics that matter, this post is a universal list of 5 ways to use Google Analytics to report the success of your businesses SEO efforts.

1. How to View Only Organic Search Traffic

This one might seem obvious. I’m always surprised at how many companies see a decline in overall website traffic and immediately jump to the conclusion that the traffic loss is due to a decline in organic search traffic. Many times digging a little deeper can actually reveal that organic traffic is up while other traffic sources are down which is resulting in the overall traffic decline.

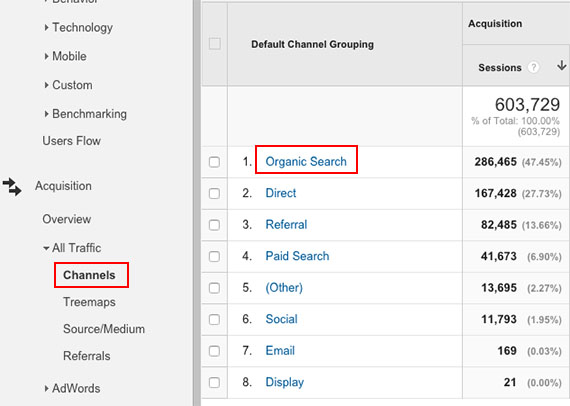
The first step in looking at Organic Search traffic over time is to open your Channel Grouping report which can be found by clicking Acquisition > All Traffic > Channels. There you will see traffic sources segmented by channel.
organic-search-channel-google-analytics

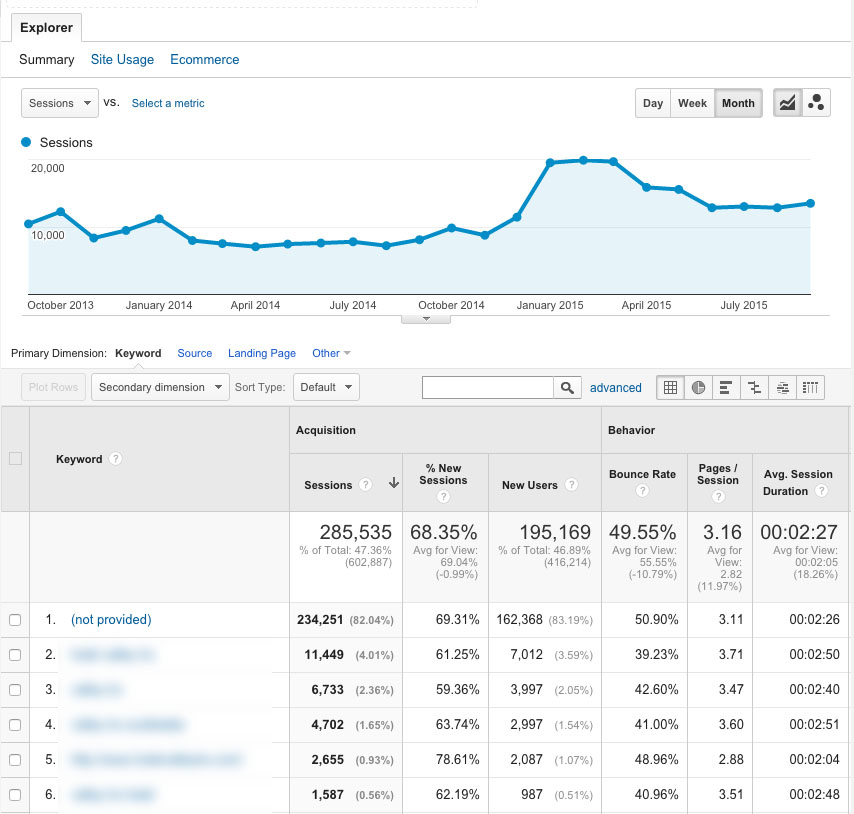
Clicking on the “Organic Search” channel will give you a more detailed report which includes only organic search traffic metrics.
organic-search-detailed-google-analytics

This report will be the Swiss Army Knife to your SEO reporting. From this report you can determine things such as the top landing pages for search traffic, keywords driving the most traffic, which search engines are sending the most traffic, top exit pages and much, much more.

2. How to Measure The Quality of SEO Traffic

A lot of times I hear that “quality” is subjective, so you can’t really measure it. I don’t believe this to be true and in fact, I’d say there are a lot of ways to measure the quality of any traffic source, not just search.

The most common report I use to measure an improvement or decline in the quality of search traffic is the Assisted Conversions report (Conversions > Multi-Channel Funnels > Assisted Conversions). With this report active I like to start by setting the date range to ‘Last month’ and comparing it to ‘Previous period’. What you’re left with is a month-to-month comparison of conversions directly from search, or in the event of multiple visits to the site, conversions where search played a role but is not directly attributed with the conversion (ie: the visitor found the company through search, but returned directly and converted).
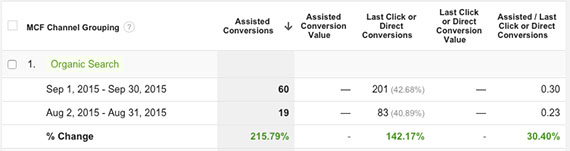
assisted-conversions-report-google-analytics

Use this report to look for a decline or improvement in conversions from search traffic. If businesses notice a decline in conversions from search, yet overall search traffic is steady, it’s easy to determine that the traffic coming from search is not qualified or of a very high quality.

Likewise, if you begin focusing on a more refined set of keywords and see an improvement in conversions from search traffic, you can say your SEO traffic quality is improving.

3. Assigning Dollar Values to Organic Traffic

This is a strategy I use for businesses who are looking for a more traditional way to understand the value SEO is bringing to their business beyond improvements in traffic, visibility and conversions by assigning a dollar value to their organic traffic results. To assign a total dollar value to a sites organic traffic, I compare how much the keywords would cost if purchased in a Google AdWords campaign.

Note: For this strategy to work you will need access to a Google AdWords account, and your Analytics will need to be synced with your Search Console account.

To find a sites keyword search phrases and queries, navigate to Acquisition > Search Engine Optimization > Queries.

search-queries-google-analytics

With this report pulled up, open your AdWords account in a new tab and click Tools > Keyword Planner. For this strategy we want to choose “Get search volume data and trends”, enter the top keywords from your Google Analytics Queries report, and click “Get search volume.” On the next screen click “Keyword Ideas.” Each keyword you’ve entered will have a Suggested Bid amount which is an estimate of what advertisers are currently paying per click for each keyword listed.

suggested-bids

In a spreadsheet I will list all known keywords driving traffic to the website, the amount of click-throughs from each keyword, and the estimated cost-per-click. The final column in the spreadsheet is the sum of the estimated cost per click multiplied by the amount of clicks, resulting in the total organic traffic value per keyword.
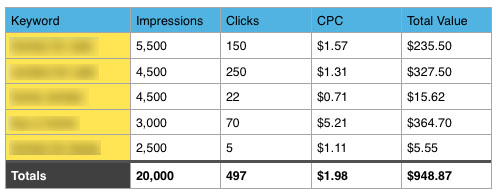
dollar-value-of-seo-traffic

This is a great strategy to visualize what kind of dollars and cents a businesses SEO strategy is saving them on traffic they would otherwise have to pay for.

4. Identifying Slow Loading Page Times

The need to optimize page load times is one item that is majorly overlooked by many SEO’s. In addition to how slow loading pages affect the user experience, page speed has become a major factor in search rankings. That’s why I always suggest that if a business is investing time and money in SEO and keyword rankings, don’t blow it by overlooking a slow loading website.

While we aren’t going to talk about how to make a website load faster, I want to look at how to identify slow loading pages and measure their impact on conversion rates.

To measure page load times on a page-by-page basis navigate to Behavior > Site Speed > Page Timings. I like to set the middle column to ‘Avg. Page Load Time’ and the right column to ‘% Exit’. I also will typically add a ‘Secondary Dimension’ of Medium, and filter down to show only organic traffic.

organic-traffic-only-google-analytics

page-load-times-google-analytics

What this report shows us in the top most row is the average page load time site wide, and the average exit percentage (where a visitor decides to leave the site) on a page-by-page basis. It’s also fairly easy to see in this report that as our page load time surpasses our site wide average, our exit percentages begin to skyrocket.

As an SEO, what I will do is bring this report to the site developers and ask them to do everything they can to optimize page load times. Once page load times have been improved, I will run this same report and compare it to the old data to show how much additional search traffic we’ve retained, and most likely converted due to the improvement in page load times.

5. Create Your Own SEO Dashboard

Sometimes all it takes to move a client or boss from a skeptic to a believer in your work is how the data is presented. It’s easy as an internet marketer – or more specifically an SEO – to over explain ourselves, or lean on hard-to-grasp metrics. Sometimes all the client wants to see is bar graphs, pie charts and other less intimidating forms of measurement.

The best way I’ve found to present Google Analytics and SEO data is through the built in Dashboard interface. A Dashboard is essentially a series of Widgets which pull all of the individual reports into a single view which is easy to access, share, and print. The bonus to having an easily presentable PDF of SEO metrics is the fact that having this dashboard will also cut down on your time spent reviewing Analytics letting you focus on actually doing the SEO work.
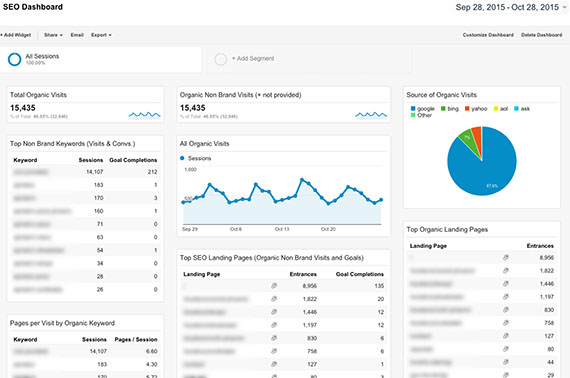
seo-dashboard-google-analytics

If you want to skip the details and import my dashboard you can do that, otherwise click on Dashboards > + New Dashboard.

The first widget I always set up is a simple counter to measure total visits to the site from organic search. Click on “+ Add Widget”, and title it “Total Organic Visits”. For this widget I usually stick with the ‘Metric’ display. Under “Show the following metric:” select ‘Sessions’. Since we only want to see traffic from organic search we need to create a filter. Under “Filter this data:” select Only show > Medium > Exactly matching > organic.
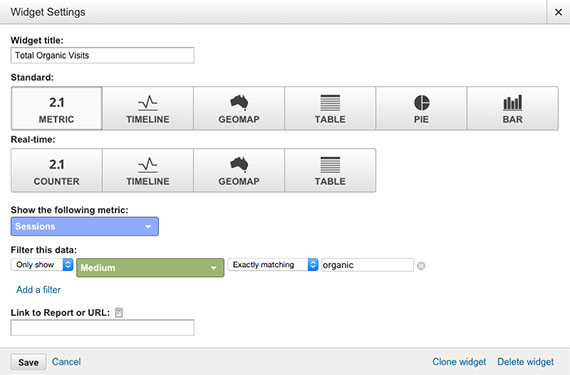
total-organic-visits-google-analytics

Let’s set up one more widget. My second favorite widget measures keyword phrases sorted by the amount of sessions and goal completions resulting from the respective keyword. Let’s add a new widget like before, but this time let’s set our display as “Table”. Under “Display the following columns:”, choose Keyword > Sessions > Goal Completions. We also want to apply the same organic traffic filter as our first widget.

top-keywords-google-analytics

I like tailor these reports to the specific client, but other widgets I usually create include:

  • All Organic Visits Over Time (Timeline)
  • Top SEO Landing Pages
  • Top Organic Keywords & % of New Visits
  • Pages per Visit by Organic Keyword
  • Most Successful Keywords by Goal Completions

Turning a Challenge Into a Strength

By far, the single most challenging aspect of being an SEO is being able to effectively articulate the value you are bringing to a business. It’s easy for an SEO to show another SEO how his or her numbers are improving, but being able to quantify your work from a traffic and revenue stand point to a client or your boss is essential to earning and retaining business. If a client doesn’t understand what that check they’re writing is doing for their business, it won’t be long before they stop writing that check.

Pay attention to what metrics resonate with your client or boss and find a creative way to represent this data in your monthly SEO reports. For extra brownie points, when clients or bosses have shared access to the Analytics I always make a point to walk them through the custom dashboards showing them exactly what each widget is tracking and why it’s important to measure. Being able to educate your client on your process helps them appreciate the value you’re bringing to their business and view you as an asset to their future traffic goals.

About the Author: Dallas McLaughlin is a Digital Marketing Specialist at The James Agency, a full service advertising agency in Phoenix, Arizona. He blogs frequently at DallasMcLaughlin.com about Search Engine Optimization, Pay-Per-Click, and Social Media Marketing trends. If you have any questions, you can tweet him directly at @BossDJay.

Biyernes, Nobyembre 6, 2015

Using Kissmetrics to Measure the Effectiveness of Email Marketing

One of the best things about Kissmetrics is its ability to track multiple marketing campaigns at once, allowing marketers to see how each performs.

In this post, I’ll outline how you can track the performance of every email marketing campaign.

Quick Background on UTMs

One of the easiest and most efficient ways to track online marketing campaigns is with UTMs. These are small snippets of text that are added to the end of URLs. They look something like this:

http://www.example.com/?utm_source=saleslist&utm_medium=email&utm_campaign=10off

There are five variables, also known as parameters, in a UTM:

  • Campaign source (utm_source) (required) – Used to identify a specific source within a channel, such as AdWords, Facebook ads, or Twitter ads to distinguish paid ads.
  • Campaign medium (utm_medium) (required) – Used to identify a marketing channel like email, paid, etc.
  • Campaign term (utm_term) – Records the keywords used in paid search.
  • Campaign content (utm_content) – Used to differentiate ads or links in the same piece of content.
  • Campaign name (utm_campaign) (required) – Used to identify your campaign, such as your website, a specific sale, etc.

In our example (shown again below), we used three variables:
http://www.example.com/?utm_source=saleslist&utm_medium=email&utm_campaign=10off

Source – In this case, “saleslist” is the source.
Medium – This specifies that it is from email.
Campaign name – This is an ad for an ecommerce company offering people 10% off their order.

If you changed the example.com URL to your domain and sent people to your website with that URL, Kissmetrics would automatically pick up each UTM parameter and save it. You can then use it in any of our reports, which I’ll outline now.

Track Conversions With The Funnel Report

We’ll start with the most popular Kissmetrics report.

Using the Funnel Report, you can track how people move through a flow on your website.

Let’s say you’re about to launch your fall marketing campaign. You have an email going out to customers next week, and you need to track how orders you’ll get from this email. The best way to do this is through UTMs and the Funnel Report.

Just create your UTMs with Google’s URL Builder. Let’s say this is your URL:

http://www.example.com/?utm_source=customerlist&utm_medium=email&utm_campaign=fallcampaign

Then use the Funnel Report to track how well your email performs:

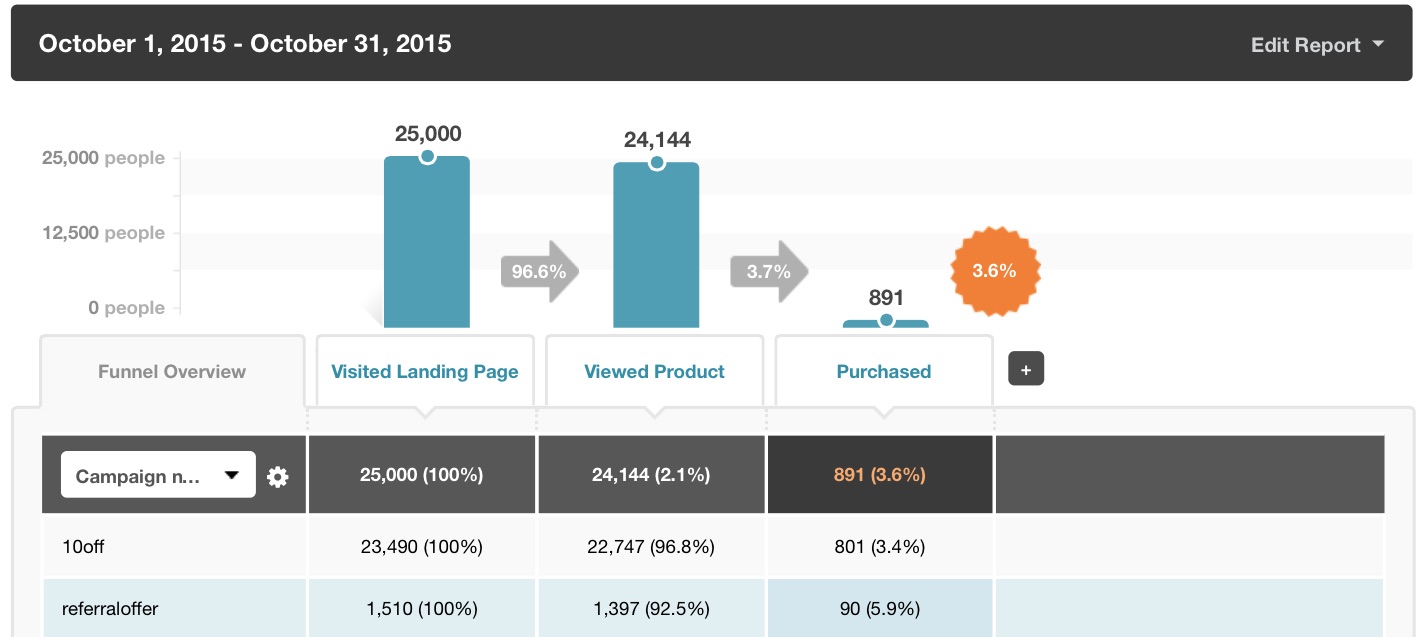
ecommerce-email-funnel-segmented-campaign-name

This funnel has three steps:

  1. Visited Landing Page – The email links to this landing page.
  2. We then track the amount of people that viewed a product after viewing the landing page.
  3. We’re then looking at total purchases from the amount of people that visited the landing page.

We’re segmenting the data by campaign name. As you’ll recall, our campaign name is 10off. When people click on a link in our email, they’ll visit the landing page and Kissmetrics will pick up the campaign name.

We also have a smaller segment of people with the referraloffer campaign name. These are users from another campaign.

We can see that during the month of October, 25k people visited the landing page. Over 23k of them came from the fall email newsletter. The majority of them went on to view a product, and a smaller percentage of them purchased a product. 801 orders can be attributed to this campaign.

Track Revenue With The Revenue Report

Seeing the conversions and number of orders is great, but to truly understand the impact this email had on the business as a whole, we’ll need to use the Kissmetrics Revenue Report. This report displays revenue performance over time and allows marketers to see which marketing campaigns bring the most valuable customers.

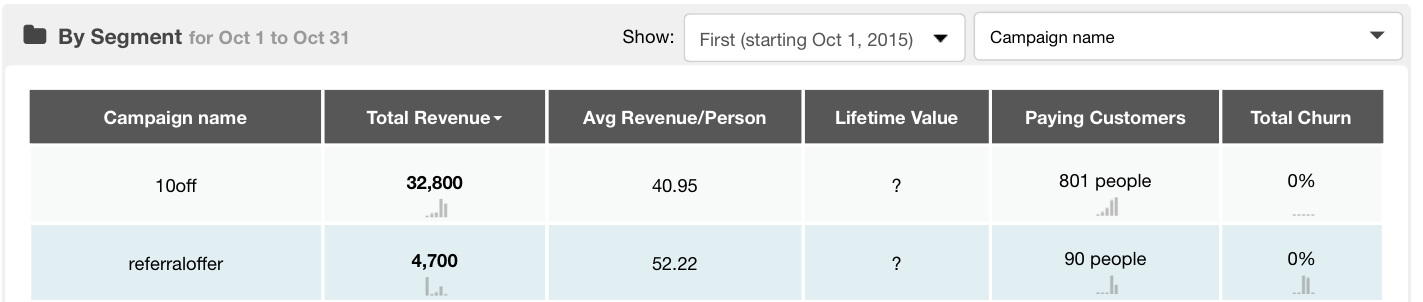
Here’s the revenue data for our fall email campaign:

kissmetrics-revenue-report-segmented-campaign-name

We see the campaign name on the left and 5 metrics to the right. They are as follows:

  1. Total Revenue – This is the total revenue received from the campaign name. In the case of 10off, all customers spent a total of $32,800 during our selected date range (Oct 1 – Oct 31).
  2. Average Revenue/Person – Pretty self-explanatory. This is a calculation of revenue divided by paying customers. Use this metric (and lifetime value) to see which segments send you the most valuable customers.
  3. Lifetime Value – This is a calculation of the total amount of money you can expect to receive from each customer. This is calculated by dividing average revenue/person by churn rate. Since churn is 0%, we get a question mark.
  4. Paying Customers – The total number of active, paying customers from this segment. If a customer has cancelled, they will not be included in the Paying Customers section.
  5. Total Churn – This is the percentage of churn for customers in this segment. We have multiple ways you can trigger churn. For Ecommerce it’s typically recommended to have churn trigger if a customer does not order after a certain amount of days has passed.

Using these five metrics you’ll be able to make data-informed decisions. You received $32,800 for your fall campaign during the month of October. Now, figure out how much money you’ve spent to acquire that email list and the software you use and you’ll have a pretty good idea of your ROI.

And you can follow these metrics as the days and weeks pass. Surely there would have been some customers that have a product in their cart but have not purchased yet. Once they do, their payment will be properly attributed to the fall campaign.

See How Each Marketing Campaign Performs

This post kept it simple and only stuck to two campaigns. If you’re running multiple campaigns on multiple channels (and what marketer isn’t) then you’ll still be able to use the Funnel and Revenue Reports to see how each performs. You can also use the Cohort Report to track retention, repurchase and conversion rates. Use Kissmetrics to show you what’s working, what’s not, and take the insights to refine your campaigns.

You can also use the Channels property to get a broader view on how your marketing channels are performing.

About the Author: Zach Bulygo (Twitter) is the Blog Manager for Kissmetrics.

Huwebes, Nobyembre 5, 2015

How Kissmetrics Helped Smart Insights Increase Monthly Revenue by 120%

Some say that running a fast-growing business is like flying a plane while they’re building it. We believe that being agile in your approach is essential, but equally important, you have to be crystal-clear on your goals and put in place the best measurement system to track performance against target and use detailed insights to optimize your inbound marketing and user experience.

I’m the CEO of Smart Insights and my company offers downloadable templates, guides and courses to help businesses use a more strategic, measured approach to increase leads and sales.

Based on this, you can easily guess we push out a lot of free content assets such as benchmarking, strategy and optimization templates. Because we have such a strong marketing content engine which gets us millions of uniques each year and thousands of leads each month, I needed to figure out how to best nurture the interest we are getting. Most people that download our content are not ready to pay for premium services straightaway. And we need to convince those that are under our freemium subscription plan that they will get more value out of our premium ‘Expert member’ plans.

Google Analytics didn’t allow me to make any actionable decisions – so I tried Kissmetrics.

Understanding, in detail, how and why our customers buy is essential to growing our business. So when we launched our Expert membership, the first thing I asked myself was: How do I figure out what my members are doing and what can I do to give them what they want?

As a digital marketing consultant, like any marketer, I immediately turned to Google Analytics. It’s great since it’s free and easy for non-specialists to pick it up and get started to view trends.

However, I wanted to see detailed insights about our customers like how long they take to buy, the latency between interacting with different content. I wanted to see this for individual freemium members when signed in and as cohorts we could track as we optimized our site. I also wanted a clear business dashboard I could review with my co-founders each month and link to our growth forecasts.

I was frustrated since we knew the insights we needed to run the business, but Google Analytics couldn’t give us the right information, with the right level of depth or accuracy due to its sampling methods. In a nutshell, we couldn’t easily figure out which content our users, prospects, freemium, and paid customers are engaging with. This is what our main member page looks like and as you can see, there are many actions (CTAs, click-throughs, hovers) that one member can take:

smart-insights-content-hub

This is why we turned to Kissmetrics. We set up tracking on all the key actions as you see above. With Kissmetrics we get full visibility on the conversion funnel because we’re now tracking what each individual person is doing on my site as they interact with different content. We also get reports that show us precisely how the business is performing each day/week/month and year which means we can prioritise our optimization efforts better.

Kissmetrics helped me grow my monthly revenue by 120%

Before I go into specific examples, I really want to share how I use Kissmetrics’ dashboards because I think every business leader needs something like this if they want to grow their business and make their customers happy.

I and my co-directors review our customized dashboard with all the KPIs that I care about as our daily business health check. We rely on the emails from Kissmetrics to hit our inboxes before I get up every morning to make sure my business is on track. We’ve configured our dashboard so we have a breakdown of things like revenue, leads, sales–and the conversion of those–and we can easily track all these KPIs against our multiple membership tiers.
A more concrete example is when we launched our new interactive benchmarking tool a couple months ago and now with Kissmetrics we’re able to see exactly how many people started using this new product mapped back to their membership tier, role and organisation. I was able to figure out what features were the most useful for the different segments. This datapoint is gold for marketing programs because we can then create a different onboarding sequence for our freemium users and paid customers. But prior to Kissmetrics, we had no idea what content is most popular to these groups. We can now run the Power Report and many others like it we have set up to get the answers to most ‘what if’ questions when we’re trying to figure out things like this. I find the Power Reports indispensable because it allows us to validate and prioritizes our ideas.

We also advertised and promoted this new product on different channels so not only is it important to nurture the ones who are interested but it’s equally important to feed the funnel with new interests. By running the Cohort Reports, week by week and month by month, I can start to break out what channels are bringing in the best traffic. Thanks to our content marketing machine, SEO accounts for 70% of our conversion and email marketing is strong too. With all these insights I can then break out and welcome different segments of users with a “welcome message” that is more personalized (or in other words, a higher chance for them to convert).

I’m not going to say reporting and optimization is easy. I know from speaking in many conferences and training workshops that marketers struggle with it. This is hard work but it pays off because it impacts the bottom line of any business. For SmartInsights.com, not only are we able to increase traffic to basic membership by 214% but we now have ways to increase our monthly recurring revenue significantly by converting more free members to paid.

To Summarize

Got all that? Here’s a recap:

  • Google Analytics did not give us any actionable data.
  • We turned to Kissmetrics to give us detailed insights that would help grow our business.
  • We use the Metrics Dashboard to give an overview of our Key Performance Indicators (Revenue, Leads, Sales, Conversion Rates).
  • The Daily Metrics emails keeps our team up to date on how our business is performing.
  • The Power Report helps us answer ‘what if’ questions that previously would gone unanswered.
  • The Cohort Report allows me to see which marketing channels are bringing the highest quality traffic.
  • The Funnel Report shows me what each person is doing on my site and how they interact with different content.
  • Using insights we gathered from Kissmetrics, we were able to increase traffic to basic membership by 214% and increase our monthly revenue by 120%.

About the Author: Dave Chaffey is the CEO of Smart Insights.

Miyerkules, Nobyembre 4, 2015

How to See Which Social Media Platforms Are Sending You the Most Traffic

Social media can be an incredibly powerful tool for driving traffic to your website.

However, without analyzing your website traffic on Google Analytics it’s virtually impossible to know which social media channels are driving the most traffic.

Enter: Google Analytics Advanced Segments.

What they are

Advanced Segments enable you to isolate specific categories of website traffic within your Google Analytics reporting.

By creating Advanced Segments for your various social media channels, you are able to see exactly what channels are serving to drive traffic to your website.

What’s great about Advanced Segments is that they can be used with any of the default or custom reports on Google Analytics, making it a great way to dig in to what matters most for your business.

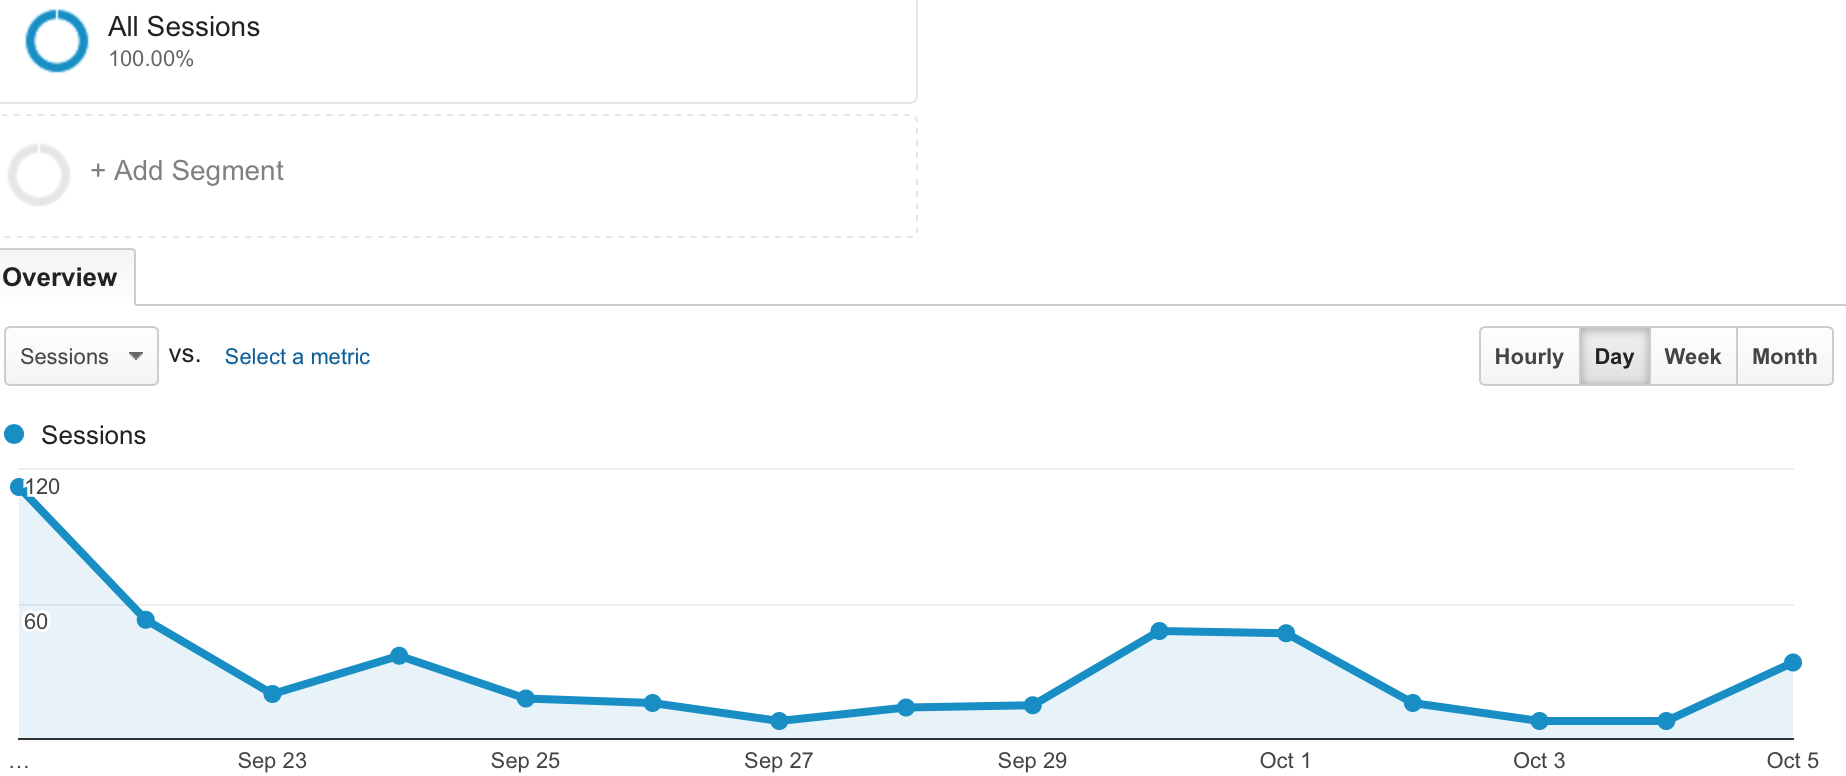
As you can see below, this is my website traffic without any added segments.

All sessions graph

There are two ways that you can tell I haven’t added any segments into this graph:

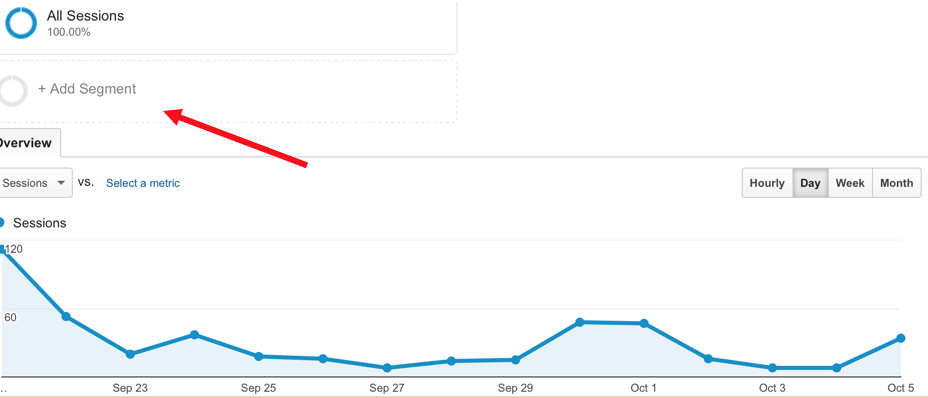
  1. You’ll notice that the “+Add Segment” box located below the “All Sessions” box is grayed out.
  2. You’ll notice that there is only one line on the graph, which represents all sessions of website traffic for the time period I selected.

Who they are for

You don’t have to be a Google Analytics Webmaster in order to benefit from use of Advanced Segments.

Advanced Segments are for you if:

  • You’re interested in seeing which demographic groups are serving to drive traffic to your website.
  • You’re wondering which social media channels drive the most traffic to your website.
  • You’re curious to learn which geographic areas visit your website the most.

Advanced Segments allow you to segment, and therefore gain valuable insights, about different groups of people and traffic sources.

This data is incredibly valuable, regardless of the industry you work in, because it will help shape your social media strategy.

How to create them

Click the “Add Segments” button located below the “All Sessions” button.

Create-Segments-google-analytics-1

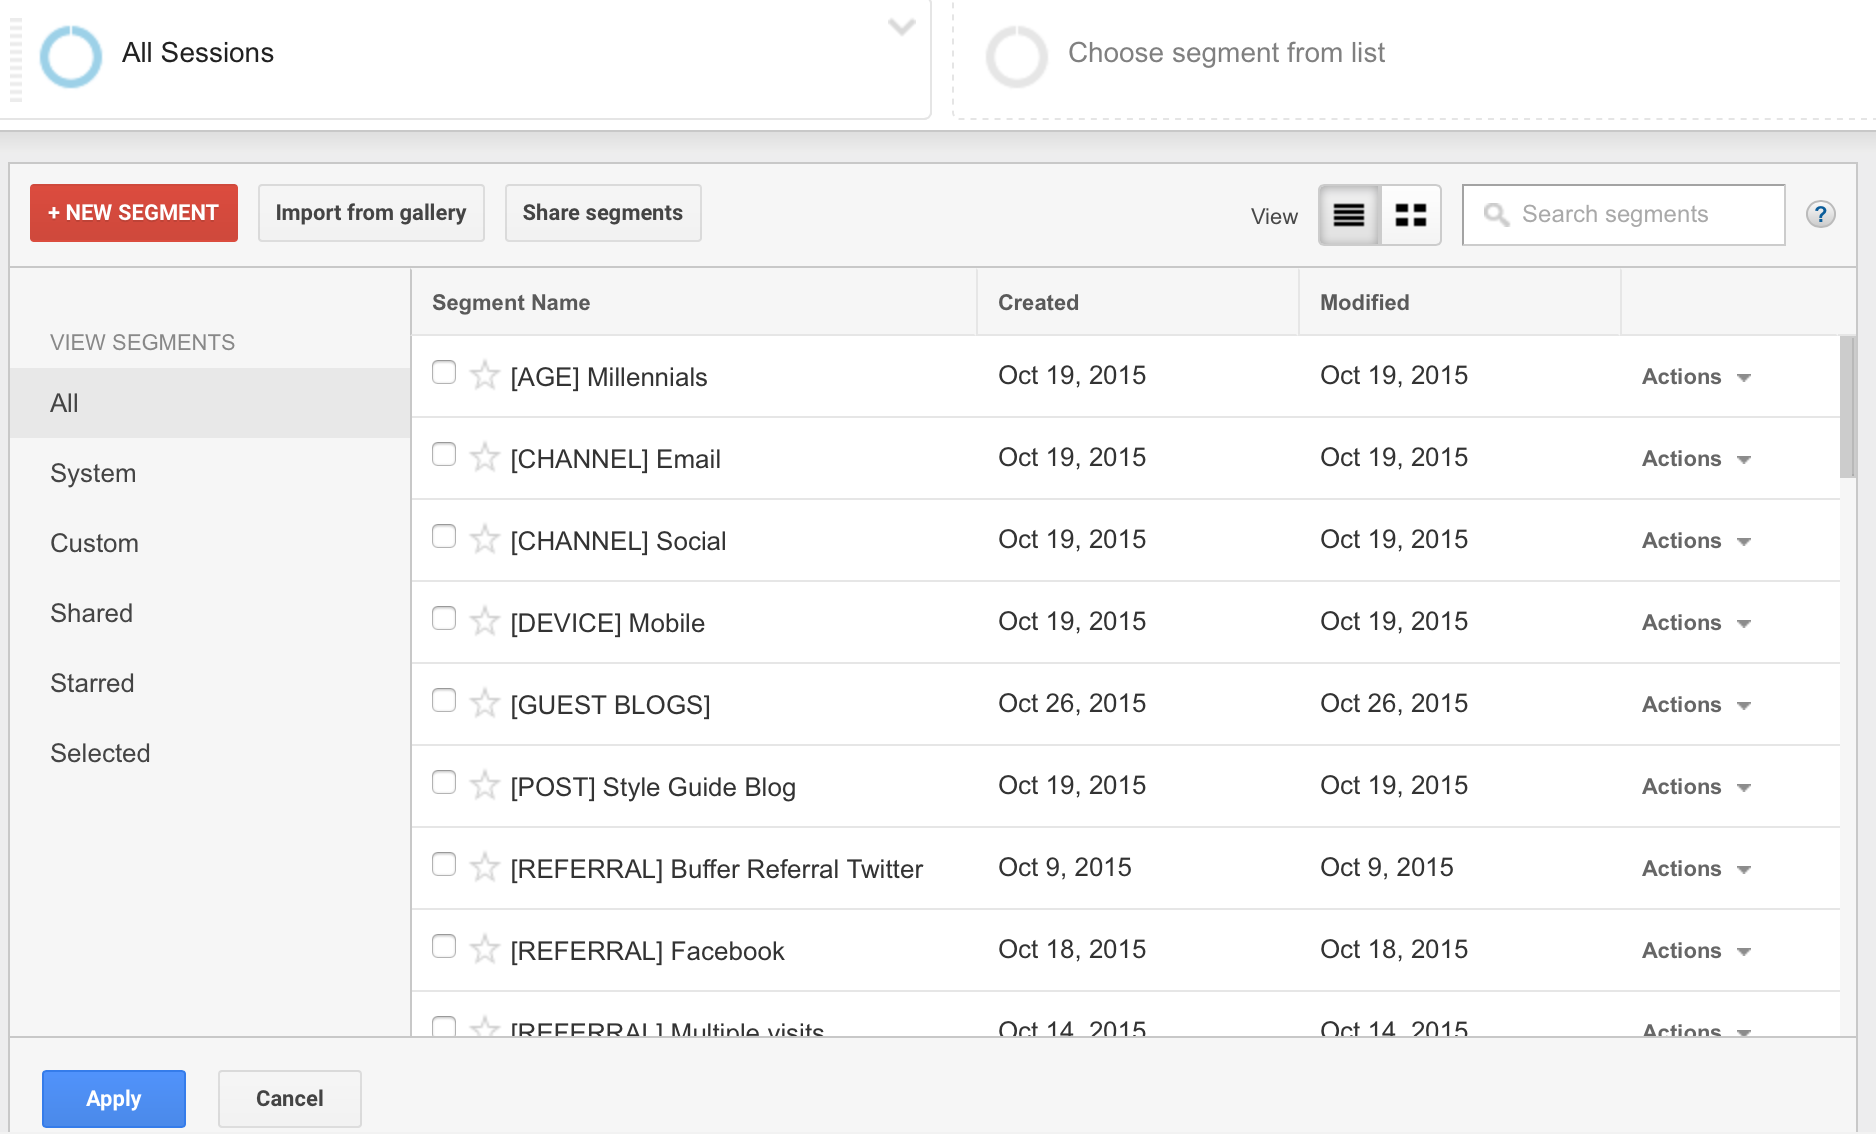
I’m brought to the Advanced Segments screen which shows all of my advanced and custom segments.

Create Segments 2

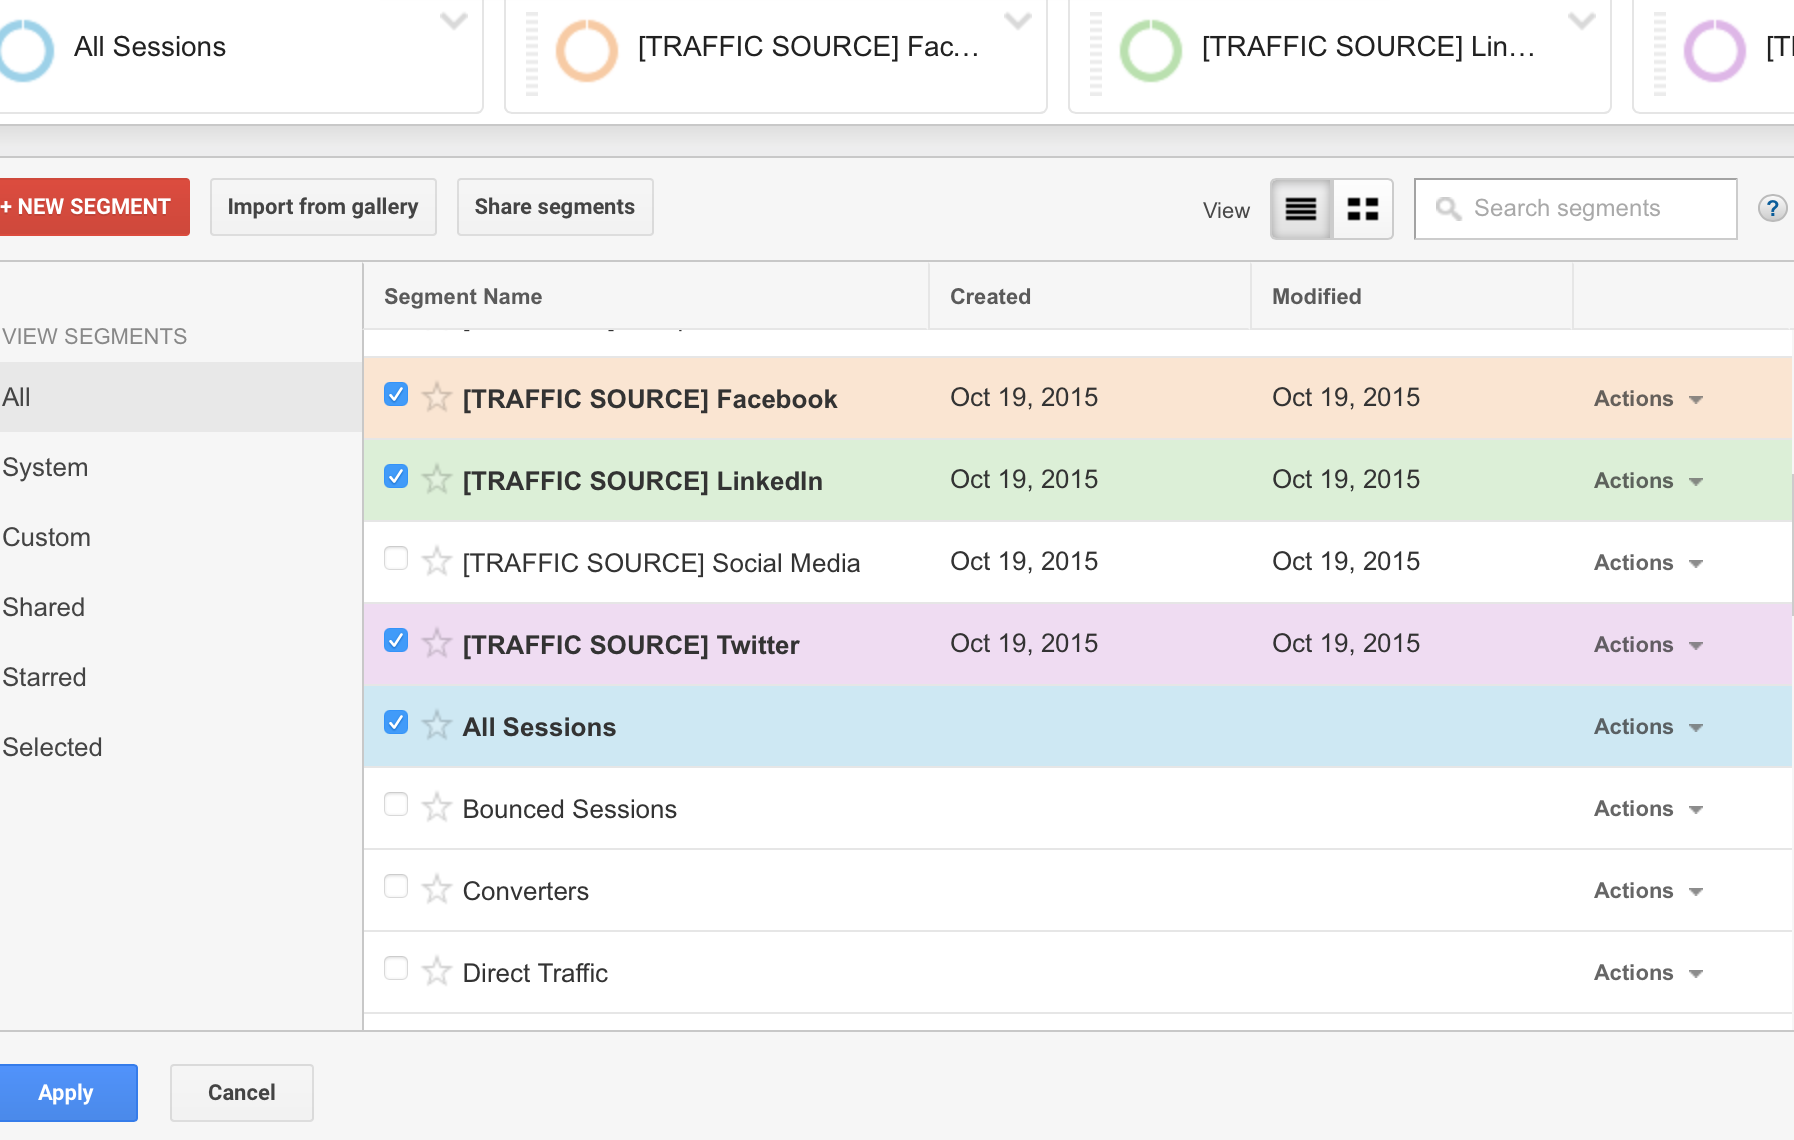
Since I already have both Advanced and custom segments created, I could click on the boxes located to the left of the Segment Name and hit the blue “Apply” box to map them against each other.

As you can see below, I have selected my segments for Facebook, LinkedIn and Twitter.

Create Segments 3

You’ll notice that my segments for Facebook, Twitter and LinkedIn are each named like this:

[TRAFFIC SOURCE] Channel name

I like naming the segments I use most often with brackets since Google Analytics alphabetizes the list of segments, and I like to make my favorite segments easily accessible.

So, let’s dive in to the step-by-step directions to create Advanced Segments for your various social media channels.

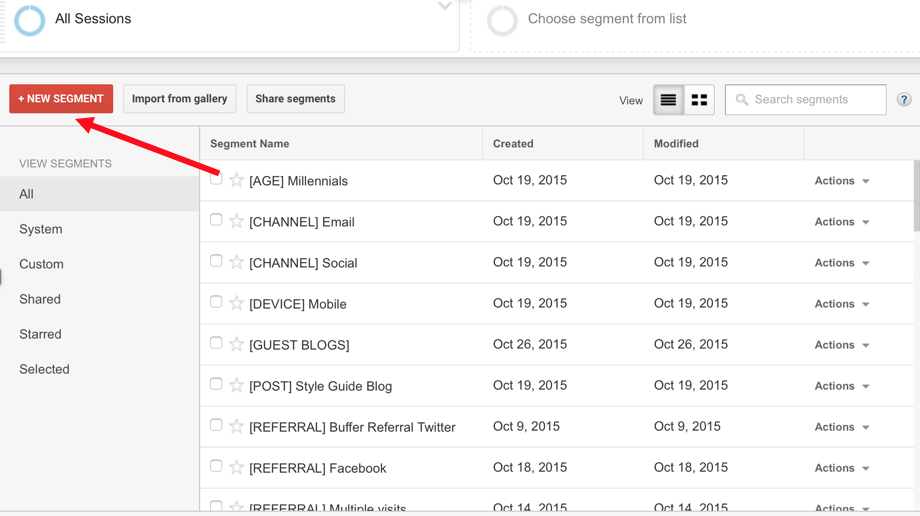
Step 1: Click the red “+New Segment” button.

Create Segments 4

Skip past the “basic” segment categories that include demographics, technology, behavior, date of first session and traffic sources, and go right to the Advanced section.

Click the “Conditions” tab.

Step 2: Create a name for your segment that includes the channel name and anything else that helps you decipher this segment. (Brackets, asterisks, etc)

Step 3: Set the parameters for the specific social channel that you want to view. (In this example I am using Facebook, but you will follow this same format for each social media segment you create.)

Firstly, to be sure that I capture all traffic that the social channel sends to my site, I use “OR” instead of “AND” statements.

Create Segments 5

Secondly, I’ll create a few iterations of source using the “exactly matches”, “contains” and “starts with” functions.

As you can see above, I have Source exactly matches both Facebook and facebook. This is important to do for each social media channel, as sometimes the source is displayed in upper case letters.

You’ll also notice that I have source contains facebook.com.

When it comes to source, for both my LinkedIn and Twitter segments I would add additional lines to include any iterations of those social media channels.

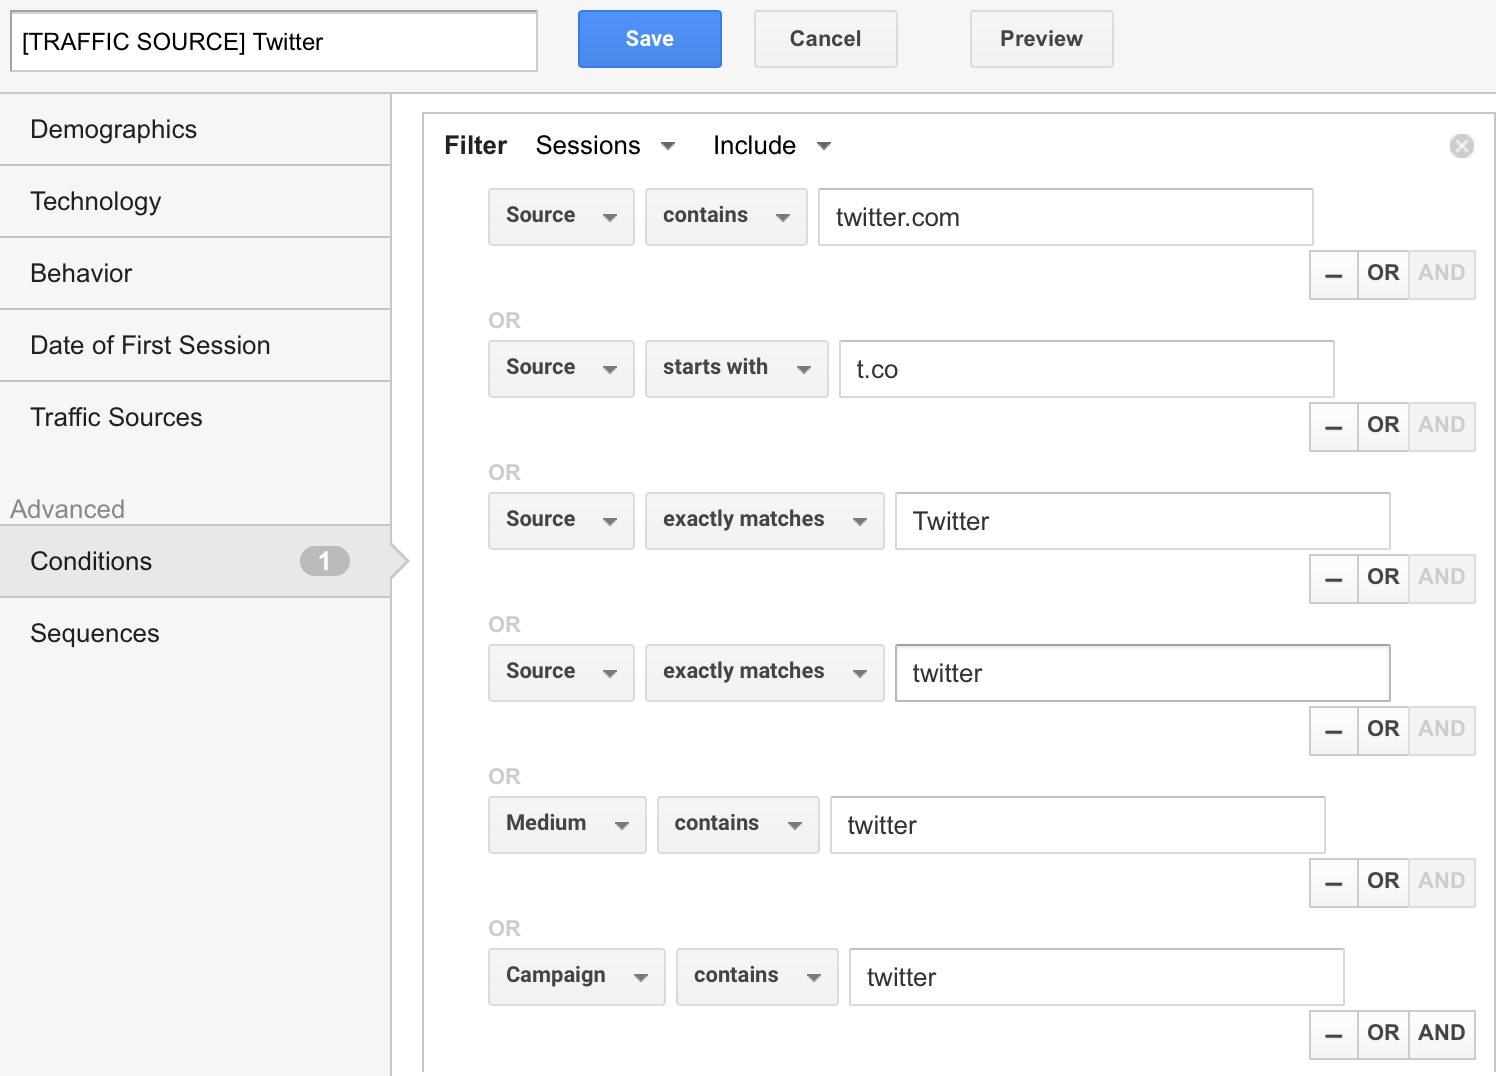
For example, traffic generated from LinkedIn can sometimes come from lnkd.in so I set that as a source. Traffic generated from Twitter can sometimes start with t.co, so I added a line in my Twitter segment that says source starts with t.co.

Once I finish all iterations for sources, I add lines for medium and campaigns, since Google Analytics can view social media sources as mediums and campaigns.

Create Segments 6

For both the campaign and medium lines, I used the “contains” function and just inserted the social media channel name. (Twitter, Facebook or LinkedIn)

Lastly, I hit the “Save” button located at the top in blue. My segment is now ready to be applied!

You can repeat these steps for all of the social media channels you want to create a segment for.

For more information on how to create Advanced Segments, I recommend checking out this great post from Kristi Hines.

Why should I care

Now that I have Advanced Segments for Twitter, Facebook and LinkedIn, I can map them against each other to see which channel is serving to drive the majority of traffic.

Segments View 1

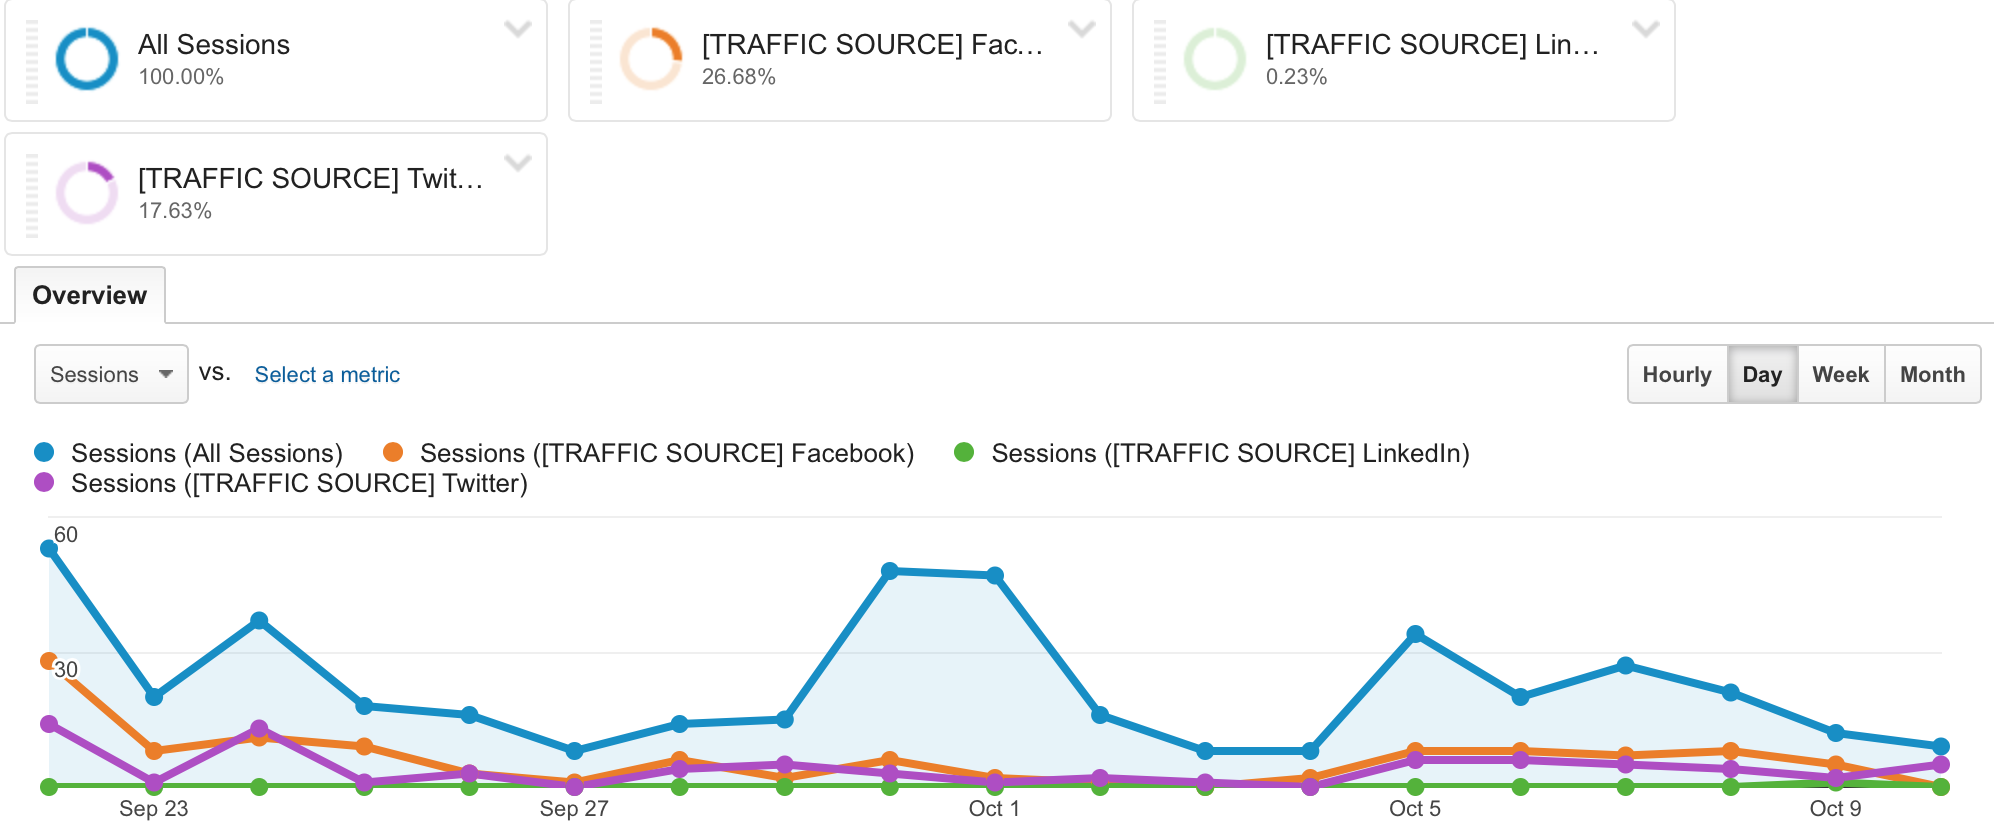
As seen above, my Advanced Segments are showing me exactly how much traffic was driven by Facebook, Twitter and LinkedIn in a nice color-coded graph.

I can see through the graph that Facebook (indicated by the orange line) is seemingly the most powerful social media channel of the three when it comes to driving traffic to my site. I also see that LinkedIn isn’t really driving any traffic to my website.

With this data, I can decide how I want to shift my social media marketing strategy to maximize the return I am getting from my efforts.

For me, it makes sense to continue sharing my blog posts through Facebook and Twitter – but not through LinkedIn.

What I might try, if I don’t want to give up on LinkedIn just yet, is share my blog posts through LinkedIn every day for two weeks and see if this graph changes at all. If it doesn’t, then LinkedIn is not the best use of my time. If it does (meaning LinkedIn starts matching the levels on the graph that I am seeing from Facebook and Twitter,) it is definitely worthwhile for me to take the time to share my blog posts on LinkedIn.

Getting advanced

To take it a step further, you can start to dig into other sections within the Google Analytics interface to see how these social media channels are serving to drive traffic to your various blog posts.

For example, head over to the Behavior tab in Google Analytics and and click “Content Drilldown” under the “Site Content” dropdown.

Segments Content View

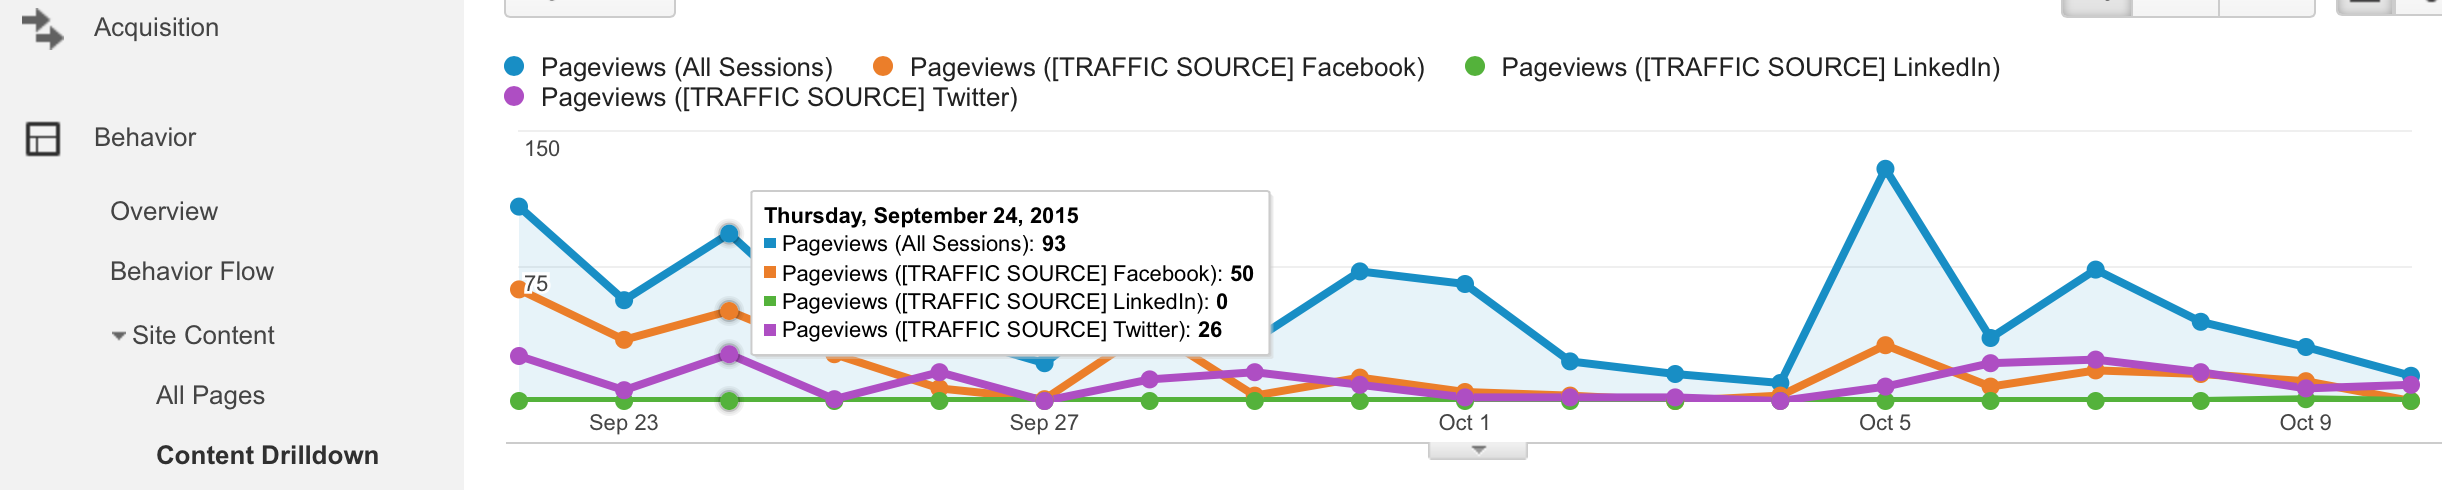
As you can see above, for the blog post that I published on September 24, of the 93 visits to my website that day, 50 were generated from Facebook and 26 were generated from Twitter.

This data is extremely valuable because it provides insights that I can now use to decide whether or not it’s worth my time and energy to share each blog post I write across all three channels.

I’m able to see in the graph above that with Twitter and Facebook, it was well for the effort but LinkedIn is not providing a return on my efforts.

Conclusion

Advanced Segments are an incredibly powerful tool.

Through use of these segments, you are able to gain insight and therefore maximize the ROI of your social media marketing efforts by seeing exactly which social media channels are driving the most traffic to your website and individual blog posts.

About the Author: Julia Jornsay-Silverberg is a social media marketing consultant and coach with a passion for helping small businesses use social media to build brand awareness and connect with customers. Be sure to check out her free guide, “Socially Strategic” to learn how to get started strategically on social media. You can also find her on Twitter and Periscope.

2015 Q3 Commercial Real Estate Market Survey

The REALTORS® Commercial Real Estate Market Survey measures quarterly activity in the commercial real estate markets. The survey collects data from commercial REALTORS®. The survey is designed to provide an overview of market performance, sales and rental transactions, along with current economic challenges and future expectations.

2015.Q3 Survey Highlights

  • Sixty-three percent of commercial REALTORS® closed a sale.
  • Sales volume rose 7.2 percent from a year ago.
  • Sales prices increased 3.8 percent year-over-year.
  • ... Read More

Will Search Engines Outsmart Marketers One Day?

A couple weeks ago, I wrote a short post for Kissmetrics titled “How Much Do Keywords Still Matter?” After investigating Google’s changing algorithms and how they’ve each affected the SEO game, I figured it would make for a good “What will SEO look like in 20 years?”-type read.

So I was understandably surprised when it got shared a lot more than I expected (over 10,000 times as of this writing when you factor in Entrepreneur’s reprint). This was, apparently, a question that a lot of people had on their mind.

The future of keyword optimization

So, just how much do keywords still matter? It’s really hard to say.

They matter less than they did, but they’re still important. And, based on everything that’s happened with Google search since we started using it, I think it’s safe to say that keywords will continue to matter less and less.

Let’s not forget that Google has already tried a keyword-centric approach and found it wanting. They’re never going back in that direction again.

Simply put, keyword optimization is just about played out.

But what about SEO as a whole?

The future of search engine optimization (SEO)

Google is the gatekeeper of SEO as we know it. Every time a new version of Google search arrives, SEO best practices change.

So, based on Google’s track record, can marketers stay ahead of the curve by predicting the future of SEO? Yes, I think we most certainly can.

With the increasing complexity of semantic search, as well as the growing adoption of mobile search, Google fully intends to move away from a world in which marketers can game SEO to a world in which marketers can only optimize SEO. One in which the context of the search matters more than what a user actually types into the search bar.

This has some very interesting implications for the near future. Effective marketing will depend more on:

  • high-quality content,
  • engaging writing,
  • and usefulness,

…and less on:

  • freshness,
  • link-building,
  • and technical SEO.

In some ways, it will almost be like a return to print marketing. Distribution aside, the best marketing of the future, like the best advertising of the past, will be whatever is the smartest and most engaging for consumers.

I almost wish this wasn’t the case. But I think it’s going to happen. Anything that can be gamed will be fixed. Search will become harder and harder to break.

The future of search

Which, of course, leads to the ultimate question: When all’s said and done—at the end of the Information Age and the dawn of the Space Age—what will search look like? What will it have to look like once we start living on other planets, for example?

The answer may be simpler than we think. Everything I’ve seen so far indicates that the future of search is intrinsically tied up with what consumers want rather than what marketers want. Buyers over businesses.

In other words, future search will be ideal search—the type of search in which the searcher is the only stakeholder, and the searched must rely on nothing other than excellent products and services. (Oddly enough, it’s not something that’s really talked about.)

One of the biggest changes is that ideal search will be less entrant-based and more context-based. Here is just some of what might come to pass while we’re all still living on the same planet:

  • Your real-time location will determine the results you get. Again, we’re already seeing this happen today, but it will be much more pronounced in the future. You could use your phone to search for “best barber” and get a different result each time depending on where you are.
  • What’s nearby will also determine the results you get. This is different than location because of the impending Internet of Things (IoT). You could be in New York, but if an LA attorney with astronomical reviews was in your neighborhood, she still might show up at the top of your search results for “dependable lawyer.”
  • The searcher can be clumsy, but the results will still be accurate. You may not really know what you want, but the search engine will. Maybe you want to figure out the cheapest way to get back home from your precise location after cancelling a return flight, but you enter something generic, like “How do I get back?” Your first result will be the cheapest one-way ticket from your exact location to your most likely destination—in this case the destination of your cancelled return flight.

Future search will be even more impressive than what I’m listing here. As someone who’s still using modern search, my imagination is understandably limited.

The future of marketing

If future search is ideal search, and if ideal search empowers users rather than brands, searchers rather than the searched—what does this all mean for marketing as an industry? Will marketers like us simply disappear?

Of course not.

Even if we can’t game search as much as we’d like, we’ll still have our hands full creating engaging, exciting content that is quite simply the best content out there (compared to our competition).

Inbound marketing and content marketing tactics will have to change with technology (and SEO), but they will be around as long as businesses have products and services to sell. And outbound marketing isn’t going anywhere, either. Disruptive marketing isn’t tied to search (not really), so it will be around no matter what the future holds.

Marketing—thank the digital gods—will be around forever.

About the Author: Alp Mimaroglu is a Marketing Luminary at Symantec. He specializes in marketing automation, demand generation, analytics, and marketing technology. Alp has extensive experience with both business and consumer marketing. He’s passionate about how technology is rapidly becoming the key to success in both the corporate sales and marketing landscapes. Follow Alp on LinkedIn and Twitter.

Lunes, Nobyembre 2, 2015

How to Get Customer Feedback from Mobile Users

Customer feedback can help you understand what features to add, what features to get rid of, and where to direct your development efforts. Adding it into your marketing plan is a no-brainer.

But mobile app companies have a unique challenge. When it comes to communicating with customers, they’re at the hands of Apple and Google.

Because these two giants privatize your customers’ information, it’s impossible to get feedback in conventional ways. Unless your users create an account, you can’t email out a survey to a customer or email list, or search for your customers on social media. You have to be creative.

Thankfully, mobile app companies have found savvy ways to get feedback from their users.

In this post, I’ll explain how you can learn what customers really think of your app:

Ask for Reviews

The simplest way to get feedback is to ask for reviews within the app. On both iOS and Android, developers can program a request for a user to rate the app, and leave a review.

The key is to find the perfect time to ask. Many mobile apps ask for ratings and reviews immediately, but this can annoy customers as they’re not yet familiar enough with the app to really give a score. Additionally, mobile app ratings aren’t just important for potential customers– they also affect how easily the app can be found in the App Store or Google Play Store.

5 rate clear

Clear, a to-do list app for iOS, has found a clever time to ask for reviews. After users have used the app for a few weeks, and checked items off their to-do list, Clear will ask for a review. At this moment, users are feeling happy about how productive they were, and are willing to share their positive feelings about the app.

Watch out: Once you have reviews, you need to read them and address your users’ issues. If you’re on the quest for positive reviews, it might be difficult to get the feedback you need to improve your app.

Use In-App Net Promoter Score (NPS) Surveys

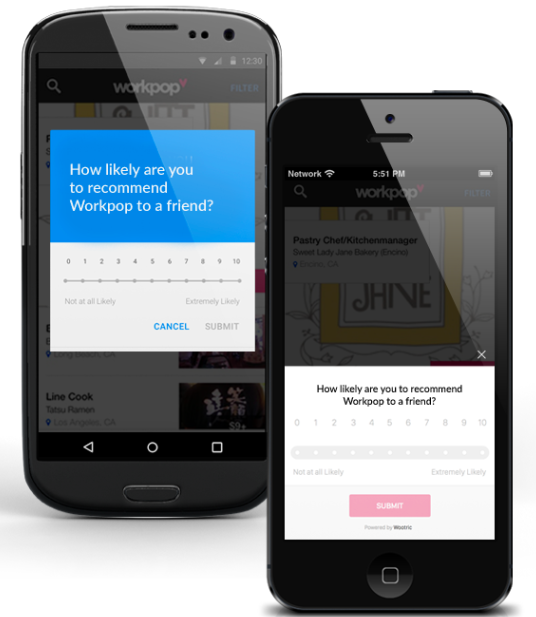
Net Promoter Score (NPS) is a way to measure general customer sentiment, but also allows customers to send individualized feedback. This process divides respondents into three groups: Promoters, Passives, and Detractors, based on how they answer the following question:

nps-survey-recommend-product-to-friend

By measuring how many people would recommend your product, you’re able to learn your customer’s general sentiment.

nps-survey-in-mobile-app

NPS includes a follow-up question, as well, which asks users to explain their score. In the follow-up question, you’ll be able to get rich, individualized feedback that you can act upon.

The best part of NPS is that you can easily add it to your mobile app. The process is seamless for users– they don’t have to leave your app to give feedback. Wootric has mobile SDKs for Android and iOS, so you can add an NPS survey directly into your app and collect rich customer feedback immediately.

You can also prompt Promoters to review your app in the App Store, which will help your overall app ratings.

Watch out: NPS works best when you’re regimented about when you’re collecting data. You need to make sure you’re asking customers how they feel at the right times, whether the survey is triggered by events (user completes a task) or amount of time (user has had the app for 10 days).

Savvy Support Communities

You’re focused on mobile, but that doesn’t mean you should do everything from your app. A great way to collect customer feedback is to create off-app communities where users can voice their opinions, ask for help, and engage with your team.

Here are a few ways app companies can create communities:

  • Offer support through social media (Twitter works well) and email
  • Create a blog that encourages users to share their stories. Make sure to have a comments section.
  • Create a web forum on your site to help users connect and share their experiences. UserVoice is a great product for gathering feedback and hearing from users.
  • Make sure there are tons of avenues for customers to get in touch directly with your team.

Watch out: Communities are great, but the process for collecting feedback isn’t seamless, as users have to leave the app. This can affect the amount and quality of the feedback.

Use Beta Tests

Mobile app developers often use beta tests to learn how customers feel about their apps, especially before releasing full versions.

“Beta testing does not need to be on a big scale or have to be overly complex to be useful,” wrote Mike Fine, Director at Center Code, a beta test management company, on Quora. “In fact, a mobile developer can execute a small test among his or her users to great success as long as a strict beta process is followed and best practices are used.”

On your website, you can collect potential beta users with a web form requesting their email addresses. Then, you’ll have a good way to communicate with these users as they explore your app.

Watch out: Make sure your beta tests follow best practices and that you use a refined process when asking for feedback. Don’t email back and forth with beta testers– instead, come up with a survey to send them.

Act Upon Mobile Feedback

Once you’ve got feedback from your mobile users, you need to act upon it. Otherwise, your customers will feel like their voices don’t matter, and that you’re not interested in creating a better experience for them.

Track the Right Metrics

Mobile is taking over the world, and in order to be successful, you need to be tracking the right metrics. You should track:

  • The percent of purchases made through mobile devices
  • The amount of web visits from mobile
  • Time on site on mobile vs. your website
  • Number of daily installs, and their sources
  • Measuring effectiveness of marketing initiatives

This post details more about must-have mobile metrics.

How to Mine Customer Feedback When You Have Tons of It

If you’re using automated feedback mechanisms, such as triggered requests for app reviews or NPS, then you might get inundated with customer feedback.

Focus on things that are easily quantifiable. For example, if you’re using NPS, you’ll easily be able to determine how many customers love your app, simply by seeing how many customers are Promoters.

If you’re not using NPS, you should search the feedback for common strains. Are many people complaining about bugs? Are people unhappy with how slow the app is?

How to Encourage Customers to Give Continuous Feedback

Sending out a survey once a year isn’t a great way to get feedback. It happens once, and you’ll spend the rest of the year wondering what customers are thinking.

In order to encourage customers to give continuous feedback, build feedback channels into the app experience. Come up with a schedule that’s triggered by a user’s actions.

For example, when they’ve been using the app for 10 days, ask for a review. After three months of active use, ask them to update their review.

Get Going

It’s challenging to get helpful feedback from mobile users, but with a little creativity and the right tools, it’s easily possible. Got any other ideas on how to get feedback from mobile app users? Let us know in the comments!

About the Author: Emma Siemasko is a freelance writer and content strategist who helps SaaS and mobile tech companies share their stories. She’s the founder of Stories by Emma, and you can connect with her on Twitter.